jernwerber.dev: words & code
About me ⚡️LIGHTNING ROUND EDITION⚡️
Coding
- JavaScript · HTML5 · CSS3 · Markdown · Liquid · Python (with Django) · C# · SQL · Java & PHP
Instructional design
- Adult learning · K-12 learning · Instructor-led training · Self-directed learning · Technical training · Professional development · Adobe Captivate · Articulate Storyline & Rise
Other
- Digital productivity suites (Microsoft Office · Google Workspace)
- Live streaming / broadcasting (OBS Studio · Zoom · Google Meet)
- 2D design (Graphic design · Print layout · Digital video production)
- 3D design & fabrication (Autodesk Fusion 360 CAD · FDM/FFF 3D printing · LightBurn · Laser cutting)
- Ed tech (Micro:bit · Ozobot · Makey Makey · Lego Mindstorms)
- Research (IBM SPSS)
- Miscellaneous (Wood-working · Soldering · Basic circuit layout · MIG welding (beginner))
Recent posts
-
Breaking even on a house: Rising prices are an inevitability because of transaction costs
We recently bought a house. Now, with all the hemming and hawing about telework/remote work from the folks who had just recently been touting “Digital first!” and “The new normal!”, I got to thinking about about what it would take to sell this house should we be forced to move for work. Even if I just wanted to breakeven on this transaction (i.e. net cost of 0, just recouping the money spent on the purchase, nevermind the opportunity cost of the money committed to this endeavour), it isn’t as simple as pricing the house for the same price that we bought it for: to reach breakeven, the price needs to go up for every successive transaction, regardless of if the value of the property changed. You can see this in the visualization below. The key takeaways:
- Sale price needs to increase by around 5% transaction-over-transaction to reach breakeven on successive transactions.
- After 3 sales (starting at $785,400 and selling at $915,708), there is a cumulative sale price increase of around 16.6% required to breakeven. After 6 sales (starting at $785,400 and selling at $1,067,636), the cumulative sale price increase is around 35.9%.
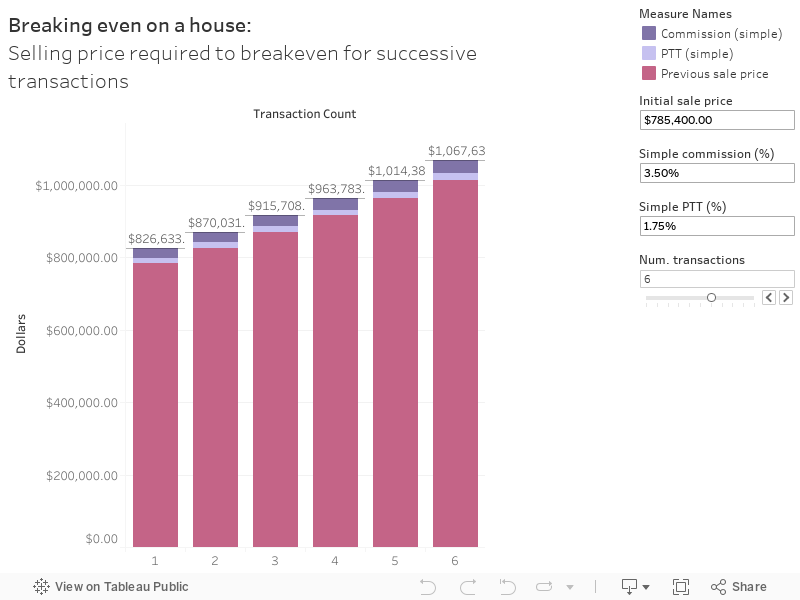
Note: Commission rate & property transfer tax rate were simplified to flat percentages for ease of creation, but they are described (and calculated) in greater detail below the fold, so the values might not be exact matches.
Keep reading → -
PSA: Stop saying 'down deposit'
There is no such thing as a down deposit.
I’ve seen this erroneous phrase used more than a few times and I feel strongly enough about it to write a few lines for anyone who wants/needs the clarification. Most often, I’ve seen this phrase used in the context of large purchases, especially property. Best I can tell, this is a combination of two other money-related things: down payments and deposits.
I’ll allow that it can be a bit confusing since you might deposit (the verb) the money for a down payment somewhere. But the two concepts contained within the phrase aren’t even all that related to each other.
Keep reading → -
Now that AI can code...: Can it, though?
Whenever I see a phrase like “Now that LLM/GPT/AI can <VERB>…” I think I do what anyone with even a little bit of knowledge about AI (and especially generative models) does and think, “Hold on there a minute. Can it <VERB>?” If I’m wrong, I’m sure someone will correct me, but my understanding is that the transformer-based large language generative models (cough ChatGPT cough) that are all the rage right now don’t really do anything except generate text passages.
So, no, it can’t <VERB>.
But, you might ask, “Isn’t generating text basically the same as having someone type out that same text?” To which I would respond, “That depends on if you think the product is the only thing that matters. Otherwise, no.” Despite (potentially) producing the same product, the underlying understanding that determines that product is very different for humans and AI and I think that ignoring (or not recognizing) this difference leads some folks to believe that AI is more capable than it is.
Keep reading →
subscribe via RSS